
Community vote
About
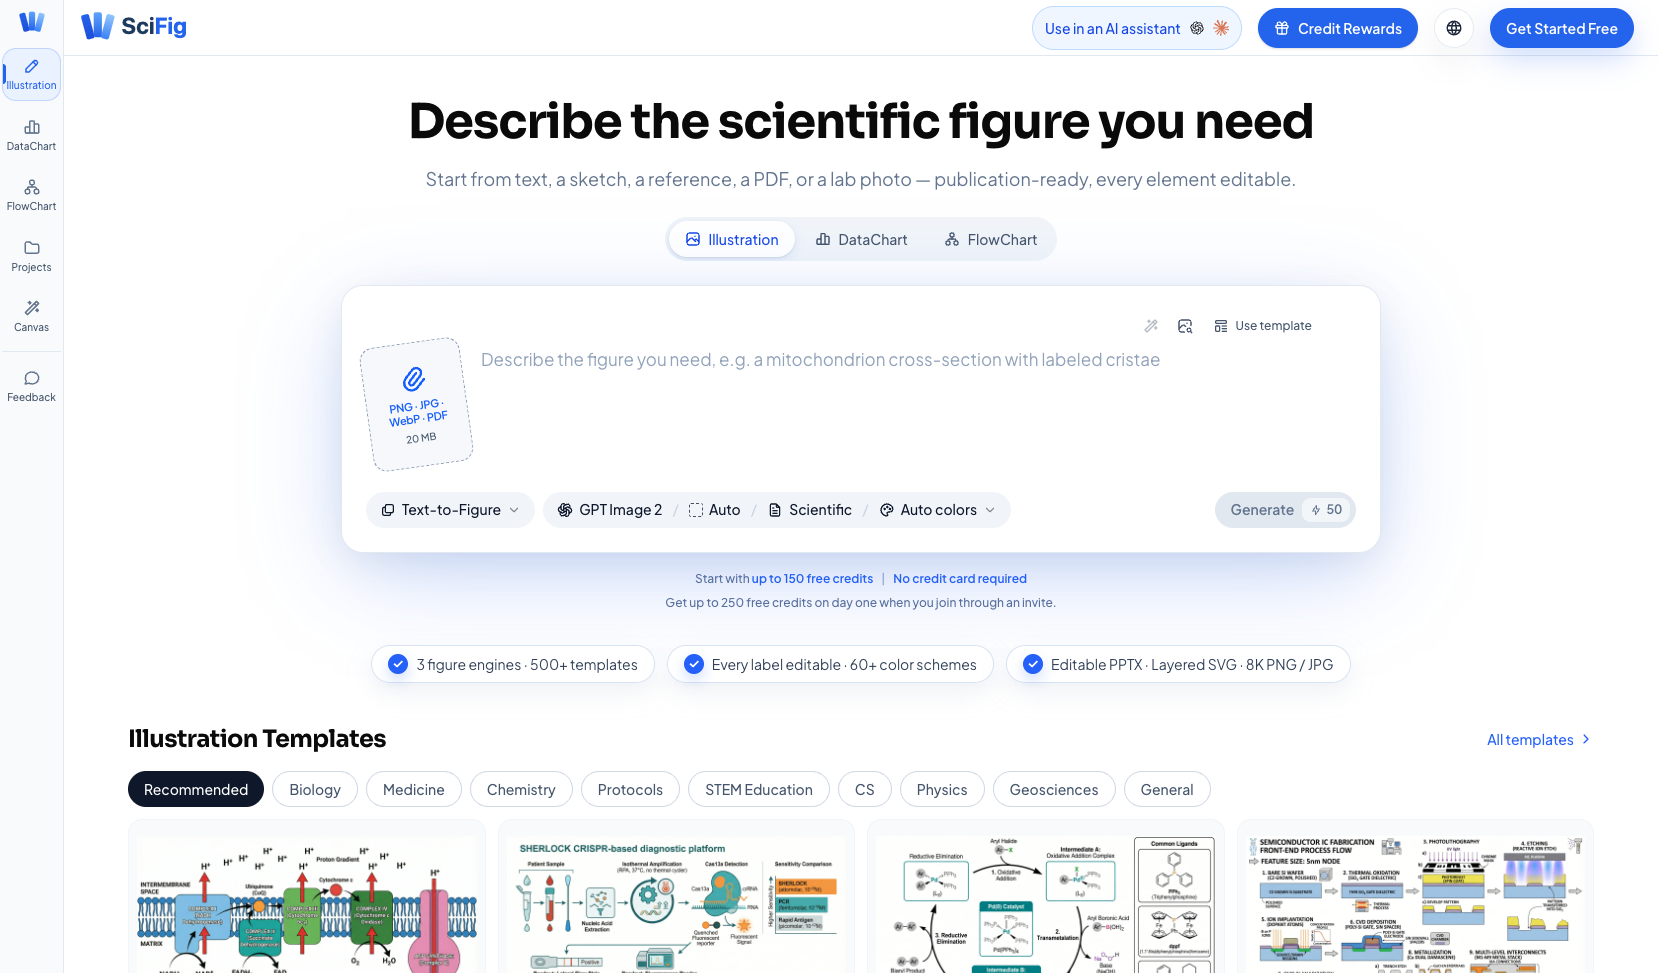
SciFig helps researchers prepare visuals for papers and presentations. Make scientific illustrations from text or references, chart your data, and build editable flowcharts in one place.
Plates
Comments · 1
to leave a note.
Try the DataChart workspace with your own table, or start a flowchart from a template and edit the result for your research.
