Founder field note
Product Launch Kpis: A Practical Measurement System for Early-Stage Startups
Product launch kpis for bootstrapped founders: measure acquisition, activation, retention, revenue, and launch quality without vanity metrics.
Product launch kpis are the small set of measurable signals that show whether a new software product is attracting the right people, delivering its promised value, and creating a path to sustainable use or revenue. For a bootstrapped founder, the point is not to produce an impressive dashboard; it is to decide what to fix next while traffic, feedback, and attention are still limited.
What Product Launch Kpis actually measure
A key performance indicator is not simply any number associated with a launch. It is a metric connected to a decision and a defined outcome. “Visitors” may describe attention. “Visitors who create a project, invite a teammate, and return within seven days” can help you judge whether the product is useful to the intended customer.
The distinction matters because launches create unusual measurement conditions. A launch post, founder network, newsletter mention, or community referral can create a burst of curious visitors who never had a real problem to solve. If you judge the launch by traffic alone, you may optimize for a temporary audience rather than a durable product.
A KPI has four parts
Before adding a metric to a spreadsheet, define these four parts:
- Object: what is being measured, such as a signup, workspace, paid account, or completed workflow.
- Population: which users count, such as new visitors from a launch page or all activated accounts.
- Time window: when the behavior must occur, such as during the first session or within seven days.
- Decision: what you will do if the result is weak, strong, or ambiguous.
For example, “activation rate” is too vague to be useful until you define activation. For a collaborative writing tool, activation might mean a new account creates a document and shares it with one other person within 72 hours. For an AI research tool, it might mean importing a source, asking a question, and saving an answer that can be revisited.
That event definition should reflect the product’s value-delivery moment, not the easiest event to count. Account creation is often a useful funnel stage, but it is rarely proof that the product solved anything. A download, pageview, or email capture can be a leading signal; it should not quietly become your definition of success.
Leading, outcome, and guardrail metrics
Most launch measurement becomes clearer when you separate metrics into three jobs:
- Leading metrics show whether people are moving toward value: qualified visits, signup completion, onboarding completion, or first meaningful action.
- Outcome metrics show whether the product created durable value: retained users, recurring usage, paid conversion, or revenue.
- Guardrail metrics reveal damage or friction: failed payments, support requests, error rates, refund requests, or abandoned critical flows.
A launch can have a strong leading metric and a weak outcome metric. Many people may try a product, while few return because the use case is occasional, the output is unreliable, or the onboarding promise was too broad. It can also have reasonable retention and a broken guardrail: users may return while struggling with a payment failure or a core bug.
For a first launch, choose one primary outcome KPI, two or three leading indicators, and at least one guardrail. This is a measurement hierarchy, not a permanent company-wide taxonomy. It keeps a small team from spending launch week interpreting thirty charts with no agreed action.
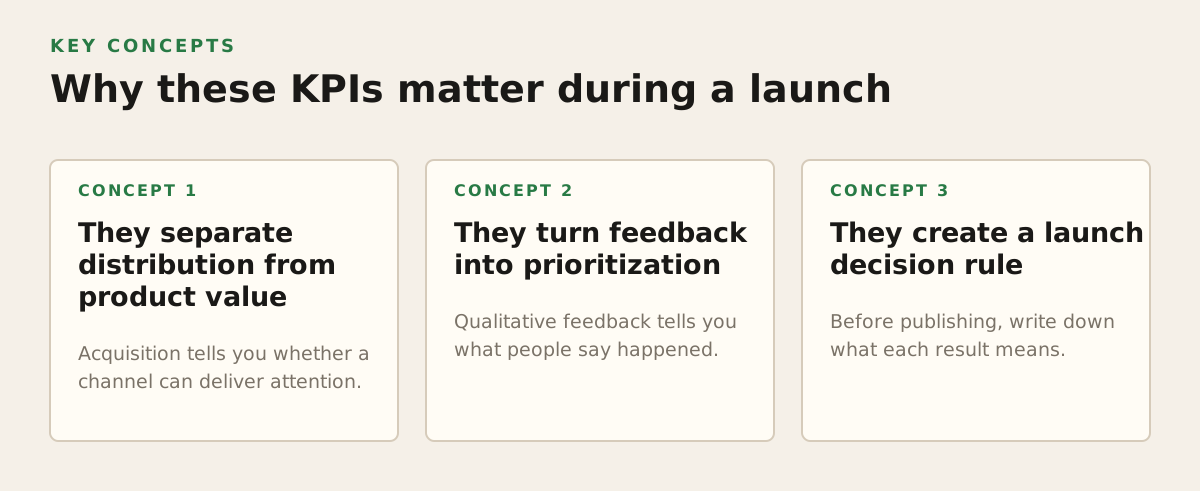
Why these KPIs matter during a launch
A launch is a concentrated opportunity to learn, not merely a promotional date. The useful question is not “How many people saw us?” but “Which people arrived, what did they attempt, and what evidence suggests they will come back or pay?” This reframes visibility as a source of product evidence.
They separate distribution from product value
Acquisition tells you whether a channel can deliver attention. Activation tells you whether the landing page, onboarding, and initial product experience convert that attention into a meaningful action. Retention tells you whether the action was valuable enough to repeat.
These stages can disagree:
- A founder community can send highly relevant visitors but produce low volume.
- A broad social post can create high traffic but weak activation.
- A partner referral can create fewer signups but stronger retained usage.
- A launch directory can produce useful early adopters whose feedback is more valuable than their immediate revenue.
That is why channel-level reporting matters. If all launch traffic is combined, a strong niche source can be hidden by a larger but less qualified source. Capture the referrer or campaign identifier before signup where possible, then compare cohorts by source rather than relying on the blended average.
They turn feedback into prioritization
Qualitative feedback tells you what people say happened. KPI changes help you estimate how widespread or consequential the issue may be. If several founders report that setup is confusing and activation falls sharply at the setup step, the evidence for improving that step is stronger than either signal alone.
Do not treat a KPI as a substitute for interviews. A metric can tell you that users abandon a workflow; it cannot reliably tell you whether they lacked permissions, misunderstood the copy, encountered a bug, or decided the result was not worth the effort. Pair a behavioral signal with a small number of direct conversations or session reviews.
They create a launch decision rule
Before publishing, write down what each result means. This prevents motivated reasoning after the fact. An illustrative starting policy for a self-funded SaaS launch could look like this:
| Signal | Illustrative read | Next decision |
|---|---|---|
| Landing-page visitor to signup | 12% | Review whether the promise and audience match; do not call this product-market fit. |
| Signup to defined activation | 35% | Watch the onboarding path and interview activated versus non-activated users. |
| Activated users returning within seven days | 28% | Inspect whether the product has a recurring job or whether the first result was incomplete. |
| Activated users starting a paid plan | 8% | Speak with buyers and non-buyers before changing pricing. |
| Critical workflow failure rate | 4% | Fix reliability before increasing promotion. |
These numbers are illustrative starting policies, not universal benchmarks. A tax tool used quarterly, an incident-response product, and a daily writing assistant have different natural usage patterns. The value of the table is that it connects each measurement to a response.
How to build a launch measurement system
Start with the product promise and work backward. If your promise is “turn a messy meeting recording into an approved action list,” the measurement plan should follow that job: arrival, recording upload, useful output, editing or approval, and later reuse. Do not begin with the analytics tool’s default reports.
Map the smallest meaningful funnel
A practical launch funnel usually includes five stages:
- Qualified acquisition: a person arrives from a source plausibly related to the target problem.
- Intent: the person clicks the relevant call to action, starts signup, or requests access.
- Activation: the person completes the product-specific action that demonstrates initial value.
- Retention: the person repeats the valuable action in a period appropriate to the use case.
- Commercial or strategic outcome: the person pays, expands usage, refers a qualified user, or provides high-value evidence for the next iteration.
Each stage needs a clear event name and properties. A generic event such as button_clicked makes later analysis difficult. A more useful event might be workspace_created with properties for template type, acquisition source, and whether the user was invited by someone else. Keep the event vocabulary small enough that you can explain every event to a future contributor.
Define activation around the job to be done
Activation is the most commonly mishandled launch KPI. It should represent a completed or nearly completed first job, not just progress through an onboarding checklist.
Use this test: if the user completes the event but receives no meaningful result, would you still call them activated? If the answer is no, the event is too shallow. If the result requires multiple steps, measure the final meaningful step and retain the intermediate steps for diagnosis.
For an illustrative project-management tool, a reasonable activation definition might be “creates a project, adds a task, and assigns it to a collaborator within three days.” The intermediate events reveal where users stall. The final event is the KPI because it is closer to the product’s promised collaborative outcome.
Be explicit about denominators. “Activation was 40%” is incomplete. Say “40% of new accounts that completed email verification created and assigned a project within 72 hours.” That sentence makes the population, time window, and behavior inspectable.
Measure retention according to usage rhythm
Retention is not always “returned seven days later.” A daily tool may be evaluated with weekly active use; a monthly reporting product may need a longer window; a one-time migration tool may be judged by completion, referral, or a second project rather than frequent visits.
Choose a returning value event, not merely a login. A user who opens the dashboard and leaves has not necessarily retained. A user who publishes another report, runs another analysis, or shares another deliverable has repeated the core job.
For early cohorts, report both absolute counts and rates. A 50% retention rate from two activated accounts is not the same evidence as 50% from 200 accounts. Small samples are useful for identifying questions, but they are weak foundations for confident generalization.
Connect events to acquisition and revenue
Analytics systems commonly distinguish ordinary events from events designated as especially important for business outcomes. Google Analytics documents events and the process of marking selected events as key events in its official guidance, which is useful when translating a product funnel into a reporting model: Google Analytics events documentation and key events documentation.
If paid acquisition is involved, keep the product event and advertising conversion conceptually separate. An ad platform may count a signup, while your product team defines success as an activated workspace. Google’s conversion-tracking documentation explains how website actions can be measured as conversions in Google Ads; use that as a reporting input, not as permission to call every tracked conversion a product outcome: Google Ads conversion tracking guidance.
For a small startup, a simple daily or weekly export can be enough. The minimum useful join is usually:
- anonymous or account-level user identifier;
- acquisition source or campaign;
- signup date and activation date;
- activation event and returning value events;
- trial, payment, cancellation, or refund status where applicable;
- error or support marker for critical workflow failures.
Do not collect information merely because an analytics platform makes it easy. Decide what the team needs to know, document the purpose, and avoid sending sensitive content in event properties. A tidy, limited event model is more valuable than a large stream nobody trusts.
Where launch KPI systems break
The most dangerous KPI failures are not always technical. They are definition failures, sampling failures, and incentive failures. A dashboard can be accurate while leading the team toward the wrong conclusion.
Vanity metrics replace evidence
Impressions, total visitors, follower growth, and raw signups can be useful context. They become vanity metrics when they are presented as proof of product success without connecting them to activation, retention, revenue, or learning.
Traffic is still worth tracking when the launch goal is awareness or recruiting design partners. State that goal plainly. A pre-seed founder may rationally prioritize qualified conversations over immediate conversion; a bootstrapped founder with a functioning checkout may prioritize paid activation. The KPI must match the stage and job.
Small cohorts create false certainty
Early launch numbers move dramatically because the denominator is small and the audience is unusual. One enthusiastic customer can distort conversion. One broken email can make onboarding appear ineffective. A sudden source spike can change the blended rate even if the underlying product experience did not change.
Use cohorts and annotate the timeline with product changes, outages, campaign pushes, and pricing experiments. Report counts beside percentages. When the sample is thin, describe the result as directional evidence and seek another observation rather than declaring a benchmark.
Attribution gets more credit than it deserves
Many early adopters see a product in one place, search for it later, ask a friend, and return through a different device. Last-click attribution can assign the signup to the final visit while ignoring the source that created initial awareness. This is especially common when founders share the same launch across communities, email, and direct messages.
Use source data to compare patterns, not to claim perfect causality. Ask new users how they heard about the product, retain a free-text response when practical, and look for repeated qualitative themes. If a channel generates signups but no activation, its apparent reach is less useful than a smaller channel that brings people with a real use case.
Instrumentation errors look like product problems
An event may fire twice, fail on a slow connection, fire before a user completes the action, or disappear after a frontend change. If a KPI suddenly changes, check measurement integrity before changing onboarding or pricing.
Google’s GA4 Measurement Protocol documentation describes sending events directly to Google Analytics, which can be useful for server-confirmed actions such as a completed transaction or a job that finishes asynchronously: GA4 Measurement Protocol documentation. Server-side confirmation does not solve every identity or consent issue, but it can prevent the dashboard from depending entirely on a fragile browser event.
Maintain a short instrumentation checklist:
- Does each event fire once under normal use?
- Does a refresh or back-button action create a duplicate?
- Can the event be tied to the correct account or anonymous user?
- Are timestamps and time zones interpreted consistently?
- Do test accounts contaminate production cohorts?
- What happens when the network fails midway through the workflow?
Quality failures contaminate every downstream KPI
A broken signup button can lower activation. An unreliable import can lower retention. A payment error can lower revenue conversion while making the pricing page look guilty. Treat reliability as a guardrail KPI, not a separate engineering concern.
Before sending launch traffic, exercise the critical path with realistic accounts, permissions, empty states, slow responses, and failed payments. A managed E2E testing service is particularly useful when you need to validate critical user journeys before launch: it can help reduce quality-related KPI failures by repeatedly checking signup, onboarding, core workflows, and other high-risk paths in CI.
How practitioners apply launch KPIs
The best measurement routine is small enough to run every week and specific enough to force a decision. A founder should be able to answer what happened, why it may have happened, and what will change next without opening ten disconnected dashboards.
Set a one-page launch scorecard
Create the scorecard before launch and give every metric a definition. An illustrative scorecard for an early SaaS product might include:
- Primary outcome: activated accounts that return to complete the core job within the chosen retention window.
- Acquisition: qualified visitors and signup rate by source.
- Activation: percentage of verified accounts completing the defined value event.
- Retention: percentage of activated accounts repeating the value event.
- Revenue: paid conversion from activated accounts, if payment is available.
- Guardrail: failure rate for signup, core workflow, and payment events.
- Learning: number of user conversations that explain a major drop-off or unexpected behavior.
The “learning” line matters for pre-seed and angel-funded teams because an early launch may be successful even when revenue is premature. If the product is still narrowing its market, a qualified design partner or a repeated pain point can be a meaningful outcome. Record the evidence and the next experiment rather than forcing every launch into a revenue narrative.
Review cohorts, not just totals
Group users by signup week, acquisition source, plan, use case, or onboarding path. Cohorts help distinguish a product change from a traffic-mix change. If activation improves only for users coming from a specific partner, the lesson may concern audience fit rather than a universal onboarding improvement.
A useful weekly review asks:
- Which cohort had the strongest activation, and what did those users have in common?
- Where did the largest qualified cohort stop progressing?
- Did retained users complete the same value event as newly activated users?
- Which guardrail moved unexpectedly?
- What single change will be made before the next review?
Keep a decision log with the date, observed signal, interpretation, change, and expected effect. This protects the team from repeatedly revisiting the same hypothesis and makes it easier to notice when a “temporary” workaround has become part of the product.
Use thresholds as operating policies
Thresholds are useful when they trigger action, but they should be labeled as policies rather than market truths. For example, an illustrative policy might say: pause additional promotion if the critical workflow error rate exceeds 3% for two consecutive checks; interview five recently activated users before changing pricing; and do not scale a paid channel until users from that channel reach the defined activation event.
Those rules are intentionally conditional. A low activation rate may be acceptable during a private technical preview if the goal is to find severe bugs. The same rate may be unacceptable when a founder is spending scarce money on acquisition. The decision depends on the product stage, customer promise, and cost of being wrong.
Choose the next experiment from the weakest link
Do not optimize the highest visible number. Find the first meaningful stage where qualified users drop out, then form a falsifiable hypothesis.
- If qualified visitors rarely start signup, test the audience and promise before adding onboarding steps.
- If signup completes but activation is weak, remove friction and clarify the first job rather than buying more traffic.
- If activation is healthy but return usage is weak, investigate recurring need, output quality, reminders, and missing integrations only when user evidence supports them.
- If retention is healthy but paid conversion is weak, interview buyers and non-buyers before assuming price is the problem.
- If paid conversion is healthy but support volume rises, improve reliability and self-serve explanation before increasing promotion.
When you are ready to put the launch in front of a broader founder audience, you can submit your product launch and use the submission as another acquisition source to label and evaluate. Treat the resulting visibility as an input to your funnel, not as a substitute for activation and retention evidence.
Make the recommendation narrow
For most bootstrapped and early-stage software launches in 2026, start with one product-specific activation KPI, one retention KPI based on the natural usage rhythm, one acquisition-quality view by source, one commercial outcome if applicable, and one reliability guardrail. Review them by cohort once a week. Add another metric only when a current decision cannot be made without it.
This approach keeps the scorecard honest: visibility earns attention, activation earns belief, retention earns confidence, and revenue earns investment. SuperPublic can help you put an early product in front of founders and early adopters through its launch and discovery platform; use SuperPublic when you want distribution that feeds a clearly defined measurement loop.
Authored with NotFair SEO