Founder field note
How to Compare Early-stage Launches By Popularity
Compare early-stage launches by popularity with matched time windows, useful attention and adoption signals, and a scorecard that avoids misleading totals.
To compare early-stage launches by popularity, line up the products over the same time window and compare visibility, meaningful engagement, and signs of adoption separately—not just a single vote or view total. A trending list can help surface launches to investigate, but it is not a universal measure of demand. On SuperPublic, trending rankings, daily and weekly browsing, and launch performance and community engagement signals can help you discover and compare listed products; the available business information does not specify a ranking formula, so treat those signals as clues rather than a definitive popularity score.
Start with a fair comparison window
Popularity is a moving target. A product launched this morning has had less time to collect attention than one that has been visible for a week. Comparing their raw totals without accounting for that difference rewards time on display, not necessarily stronger response.
First, decide what comparison you need. If you are choosing a tool to try, current interest and practical adoption matter. If you are researching competitors, sustained visibility and evidence of continued use may be more relevant. If you are reviewing your own launch, the key question may be whether a particular channel brought the right people—not whether your total exceeded another founder’s.
Then match the basics:
- Time period: compare launches over the same elapsed period, such as their first day or first week, if those dates and figures are available.
- Exposure: distinguish a launch with prominent placement from one that had fewer opportunities to be seen.
- Audience: compare products aimed at similar users or jobs where possible. A broad consumer tool and a specialist developer utility may attract different volumes and types of attention.
- Data source: record where each signal comes from. A ranking position, social reaction, website visit, and customer action are different observations.
When dates or exposure data are missing, say so in your notes. Do not treat a lifetime count as if it were a matched-window result. If you are browsing SuperPublic, daily and weekly launch views provide useful discovery windows, but a browsing category alone does not establish that two products had equal exposure.
Separate visibility from genuine interest
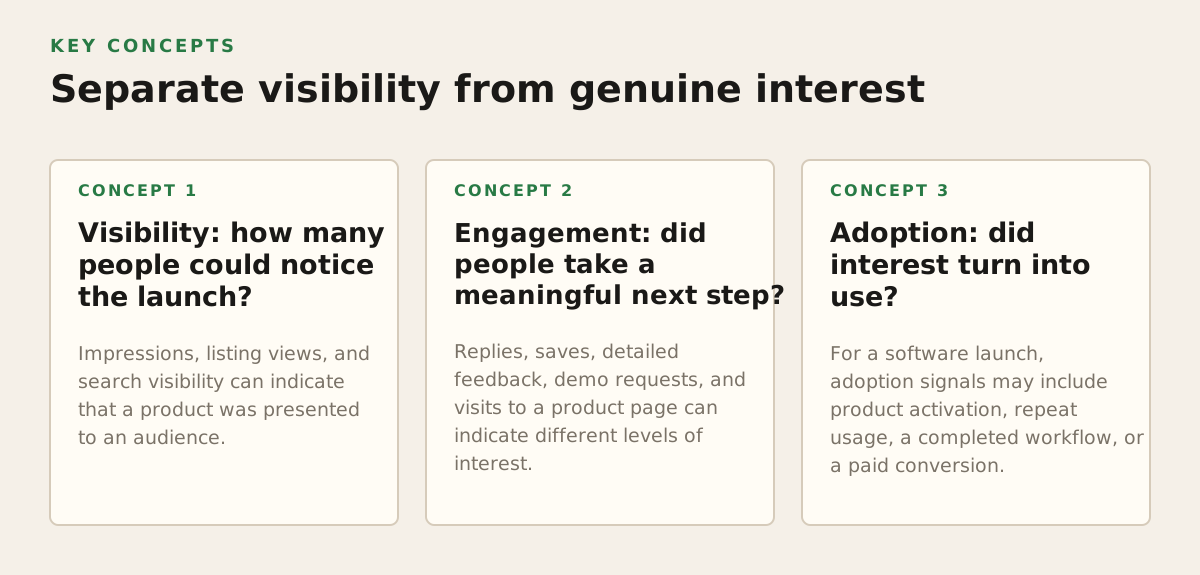
A useful comparison starts by asking what each metric can actually tell you. A large number may show reach, response, or accumulated activity; it does not automatically show that people found the product useful or kept using it.
Visibility: how many people could notice the launch?
Impressions, listing views, and search visibility can indicate that a product was presented to an audience. They are most useful for interpreting reach, not product-market fit. Google Search Console’s Performance report distinguishes search impressions from clicks and reports measures such as click-through rate and average position, so a founder can see that exposure and visits are related but separate signals (Google Search Console Performance report).
Search interest has its own limits. Google Trends describes its figures as a normalized sample of Google searches, scaled to make comparisons over time and between regions; it is not a count of absolute search volume (Google Trends data and FAQs). Use it to explore relative attention around a term, not to claim that one launch has a particular number of potential customers.
Engagement: did people take a meaningful next step?
Replies, saves, detailed feedback, demo requests, and visits to a product page can indicate different levels of interest. The more effort a response takes, the more useful it may be as evidence of intent—but context still matters. A thoughtful comment can reveal a product’s audience and problem fit; a reaction count on its own cannot explain either.
For a product site, look beyond sessions. Google Analytics defines engagement rate as the share of sessions that were engaged sessions, with an engaged session meeting criteria such as lasting longer than the stated threshold, having a key event, or including multiple page or screen views (Google Analytics engagement rate). That definition can help you understand the metric, but a visit lasting longer does not prove that a user will pay or return.
Adoption: did interest turn into use?
For a software launch, adoption signals may include product activation, repeat usage, a completed workflow, or a paid conversion. These are usually more informative about use than public reactions, but they may not be visible to someone comparing products from the outside. As an early adopter, verify the product yourself when possible. As a founder, use private product analytics to understand what happens after the click, without presenting confidential metrics as public facts.
Keep the categories distinct when you make a shortlist:
- Visibility: impressions, listing views, or ranking placement.
- Interest: clicks, questions, saves, or detailed feedback.
- Adoption: activation, repeat use, or another completed product action.
- Business outcome: a qualified lead, paid conversion, or renewal, where verified data is available.
Build a compact launch scorecard
A scorecard is useful when it preserves the differences between signals instead of disguising them inside an unexplained total. For each product, capture the observation, its time window, its source, and what it can reasonably support. Mark unavailable data as unavailable; do not substitute a guess.
For example, an early-adopter comparing two AI writing tools might record that one had higher visibility on a launch listing, while the other drew more specific questions about its export workflow. Those observations suggest different kinds of attention. Without comparable adoption data, they do not establish which tool has more active users or a stronger business.
A practical scorecard can include:
- Launch context: product category, intended user, stated problem, and launch date if known.
- Reach: the available exposure signal and where it appeared.
- Response: the kind of reaction, not only its volume—for example, general praise versus questions about a real use case.
- Use evidence: public demonstrations, product access, or founder-provided adoption data, clearly labeled by source.
- Confidence: whether the evidence is comparable, independently visible, or based on an unverified claim.
If a platform shows a trending position, record the position and when you saw it rather than translating it into a made-up score. SuperPublic lists trending product rankings and launch performance and community engagement signals, but the supplied information does not explain how those signals are weighted. That means the ranking can guide discovery; it cannot, by itself, tell you the size of the audience or the formula behind the order.
Some public signals also measure a specific kind of interest. GitHub describes stars as a way to bookmark repositories, making them a useful indicator of developer attention or intent to revisit—not a direct count of active users or paying customers (GitHub documentation on stars). When comparing open-source launches, note stars as stars and seek separate evidence for usage.
Interpret popularity without confusing it with traction
A visible launch can attract attention for reasons that have little to do with sustained product demand: a timely topic, a compelling demo, a large existing audience, or prominent placement. Those factors do not make the attention worthless. They change what you can conclude from it.
Consider these illustrative cases:
- Many reactions, little detail: the launch may have reached a broad audience, but the reactions alone do not reveal whether people understand the product or intend to use it.
- Fewer reactions, specific questions: a smaller response may still expose real buying criteria, workflow friction, or an unmet need.
- Strong search visibility, few visits: the product may be appearing for queries that are poorly matched to its promise, or its listing may not persuade searchers to click.
- Public buzz, no adoption data: interest is visible, but continued use remains unverified. Treat traction as unknown rather than inferred.
When comparing your own launch with another founder’s, be especially careful about private metrics. A screenshot or claim supplied by a founder may be useful context, but unless the measurement basis is clear, it is not a like-for-like benchmark. Ask what is counted, over what period, and whether the figure describes unique people, sessions, actions, or revenue. If those details are not available, note the limitation and keep the comparison qualitative.
For an investor or researcher, popularity is also not a proxy for company quality. A launch listing can help identify products gaining attention; assessing a business requires additional evidence about its users, market, retention, revenue, and execution. A discovery signal tells you where to look next, not what your diligence should conclude.
Use the comparison to make one clear decision
Before you collect more numbers, state the decision the comparison should support. An early adopter may want to choose a tool for a specific workflow. A founder may want to understand which message attracted qualified interest. An investor may be building a watchlist. Each job calls for a different next step, so avoid creating a popularity leaderboard that cannot answer the real question.
For a founder reviewing a launch, a useful sequence is:
- Identify the signal that matters: for example, qualified demo requests rather than general visibility if the goal is to find potential customers.
- Trace the signal to its source: separate platform engagement from activity on your own product site.
- Look for a pattern in responses: note the audience, repeated questions, and objections instead of relying only on totals.
- Choose a follow-up test: adjust the message, clarify the use case, or speak with interested people, then assess the relevant outcome.
For a product researcher, try the shortlist rather than assuming the most visible launch is the best fit. Verify the current product details directly with its maker or product page; launch listings and public popularity indicators may not establish present capabilities, availability, or suitability for your workflow.
To discover indie launches and compare the signals that are available, browse SuperPublic’s product discovery and launch pages. If you are preparing a launch, you can submit your product launch; the platform’s listed capabilities include launch-page publishing and founder community participation, but no particular visibility outcome is guaranteed. Explore what SuperPublic offers at SuperPublic.
Authored with NotFair SEO