Founder field note
Early-stage SaaS Launch Performance Comparison: 6 Analytics Tools
Early-stage saas launch performance comparison: compare six analytics tools by launch signals, setup effort, pricing model, and fit for a small SaaS team.
Early-stage saas launch performance comparison is most useful when it compares how well each tool helps a small team learn from a launch—not when it treats pageviews as success. For tracking launch traffic through to activation, compare PostHog for an integrated product-analytics toolkit, Google Analytics 4 for web acquisition reporting, Plausible Analytics and Fathom Analytics for lighter website analytics, and Mixpanel and Amplitude for product-event analysis. The right choice depends on the question you need answered, your implementation capacity, and how much ongoing analysis your team will actually do.
This is a comparison of analytics tools for one job: evaluating a SaaS launch from visit to meaningful product use. It is not a ranking of launch directories or a claim that any one tool generates demand. I assess each option on four practical criteria: whether it supports the signals a launch team needs, how much event and identity setup it implies, how accessible its pricing model is to a small team, and where its approach becomes a poor fit. No performance lifts or vendor-versus-vendor test results are assumed here.
1. PostHog

For current product details, see the official PostHog website.
Where it fits in a launch measurement stack
PostHog is a strong candidate when the team wants to connect acquisition to in-product behavior in one product-analytics workflow. Its product analytics documentation describes features such as funnels and retention analysis, which can help answer questions like “How many launch visitors reached signup?” and “Which signups came back?” Those views are more actionable than a single traffic total, but only if the product sends reliable events. See the [PostHog product analytics documentation](https://posthog.com/docs/product-analytics) for the documented capabilities.
- Best for: A technical founder who wants to inspect both the funnel and subsequent product use.
- Does not suit: A team that only needs a simple count of website visits and wants minimal instrumentation.
- Standout: One analytics choice can support questions spanning acquisition and product behavior.
Burden and commercial model
Expect a moderate implementation burden if you define events for signup, onboarding completion, and a meaningful first action; installing a tracker alone will not name those milestones for you. PostHog offers hosted and self-hosting options, so the commercial and operational choice includes whether the team wants to manage infrastructure. Its pricing page describes the current plan structure; check it alongside your expected usage before committing ([PostHog pricing](https://posthog.com/pricing)). It is a poor fit when the team cannot maintain event definitions or does not want the additional product-analytics surface area.
2. Google Analytics 4
For current product details, see the official Google Analytics 4 website.
Where it fits in a launch measurement stack
Google Analytics 4 (GA4) is a practical option when the launch question begins with how visitors arrive and behave on the website. Google documents GA4’s event-based measurement model, which can capture interactions as events rather than relying only on pageviews ([Google’s GA4 event documentation](https://support.google.com/analytics/answer/9322688?hl=en)). That can support website funnels, but a team should distinguish website events from authenticated product events: a marketing-site report alone may not explain whether a new user reached value inside the app.
- Best for: Teams already using Google’s measurement ecosystem or prioritizing acquisition and website reporting.
- Does not suit: Founders who need a ready-made, cross-product view of activation without configuring events and identity.
- Standout: A familiar choice for website measurement with an event-based model.
Burden and commercial model
GA4 is often moderate to high effort for a launch funnel that spans the marketing site and application: the team must decide how to implement events, keep naming consistent, and check that consent and identity handling suit its situation. Google offers a standard Analytics product and a separate Analytics 360 offering; review Google’s official product information for the current commercial options ([Google Analytics](https://marketingplatform.google.com/about/analytics/)). GA4 is a weaker fit if the main need is simple in-app cohort exploration and no one on the team can own measurement configuration.
3. Plausible Analytics
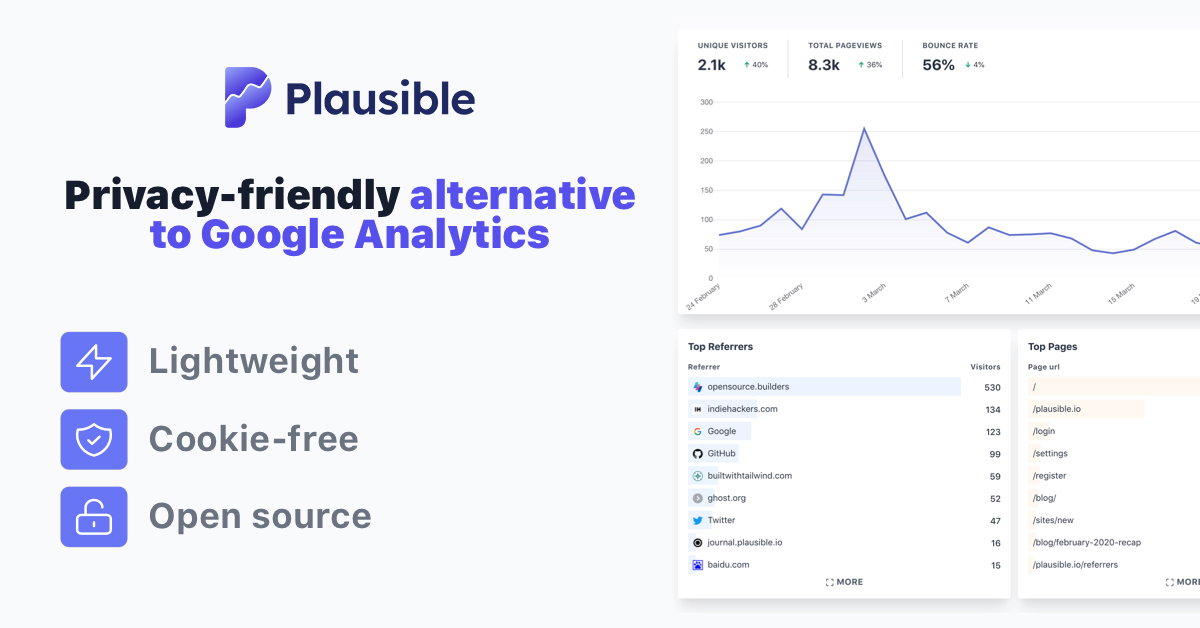
For current product details, see the official Plausible Analytics website.
Where it fits in a launch measurement stack
Plausible is aimed at teams that want straightforward website analytics rather than a broad product-event workspace. Its documentation explains how to configure custom-event goals, useful when a founder wants to track a small number of explicit website actions such as a waitlist submission or pricing-page interaction ([Plausible custom-event goals](https://plausible.io/docs/custom-event-goals)). This can make a lean launch dashboard easier to interpret, but it should not be mistaken for a complete account-level view of what users do after they log in.
- Best for: A founder who wants a compact read on launch-site traffic and a few defined conversions.
- Does not suit: Teams that need deep in-app paths, detailed user-level analysis, or extensive cohort questions.
- Standout: A narrower website-measurement job can mean fewer analytics concepts to maintain.
Burden and commercial model
Setup is generally low to moderate burden for basic site measurement; custom goals still require deciding what counts as a conversion and placing the right tracking code or event. Plausible sells subscription plans, with current options and limits set out on its [official pricing page](https://plausible.io/#pricing). This is a poor fit if the launch scorecard must follow an individual from an ad click through signup, onboarding, and repeated product use. In that case, select a product-analytics tool or plan a separate app-instrumentation layer.
4. Fathom Analytics
For current product details, see the official Fathom Analytics website.
Where it fits in a launch measurement stack
Fathom is another focused website-analytics option for a founder who values a small, readable view of site performance over extensive in-app analysis. Its official site describes website analytics and its product approach; consult the [Fathom features page](https://usefathom.com/features) for the capabilities it currently presents. For a launch, the relevant test is whether its reporting and event options answer your defined questions, not whether the dashboard looks simple in a product tour.
- Best for: A small team that wants website-focused reporting without adopting a large analytics suite.
- Does not suit: A SaaS team whose primary questions concern account-level activation, retention, or multi-step product journeys.
- Standout: A focused alternative when launch measurement can stay centered on the website.
Burden and commercial model
Plan for low to moderate setup effort for basic site tracking, rising if the team needs custom events or wants to connect website actions to application behavior. Fathom’s commercial model is subscription-based; its official [pricing page](https://usefathom.com/pricing) is the place to check current plan limits and terms. It is not the right choice merely because a team wants less setup: if activation and retention are the key launch outcomes, a lightweight website report may leave the core question unanswered.
5. Mixpanel
For current product details, see the official Mixpanel website.
Where it fits in a launch measurement stack
Mixpanel is designed for event-based product analysis, making it a candidate when the launch team needs to understand what users do after signup. Its documentation describes analysis capabilities including funnels and retention; these can help investigate where onboarding stalls or whether an early cohort returns ([Mixpanel product analytics documentation](https://docs.mixpanel.com/docs/features/overview)). The value comes from instrumented, consistently named product events—not from adding a tool before the team has agreed what “activated” means.
- Best for: Product teams that will use event funnels and retention analysis to guide onboarding changes.
- Does not suit: A founder seeking only a basic website traffic counter or unwilling to maintain event tracking.
- Standout: A focused product-analytics workflow for exploring behavioral questions.
Burden and commercial model
Implementation is moderate to high when tracking needs to cover multiple steps, user identity, and meaningful properties. Mixpanel offers plan-based commercial options; verify current limits and terms on its [official pricing page](https://mixpanel.com/pricing). A small team should compare the cost and operating effort against the decisions it expects to make. Mixpanel is a poor fit if no one will inspect the reports or if the product has too little usage to support the behavioral questions being asked.
6. Amplitude

For current product details, see the official Amplitude website.
Where it fits in a launch measurement stack
Amplitude is another product-analytics option for teams examining how users move through a product and return over time. Its analytics documentation covers charts for exploring product data, including funnel-style analysis ([Amplitude chart documentation](https://amplitude.com/docs/analytics/charts)). That makes it relevant for a launch scorecard built around signup, first value, and repeat use. As with Mixpanel, the tool does not decide which event is meaningful: founders still need a product-specific definition of activation.
- Best for: Teams that expect to explore product behavior beyond acquisition totals.
- Does not suit: A launch with no owner for instrumentation or a requirement limited to a few website totals.
- Standout: Product-focused analysis can keep launch evaluation tied to user behavior after the first visit.
Burden and commercial model
Allow moderate to high implementation effort for a useful launch analysis, especially if events need to be planned across web and app experiences. Amplitude has plan-based commercial offerings; its [official pricing page](https://amplitude.com/pricing) provides the current model and limits. Verify whether the plan you consider supports the workflows and volume you need. Amplitude is a poor fit if the team has neither the time to implement tracking nor a recurring decision that product analytics will inform.
Comparison
The table compares these tools on the same four decisions: the main launch signal they suit, their typical setup burden for a useful comparison, the broad commercial model, and their key limitation. “Low,” “moderate,” and “high” describe the work implied by the measurement job, not a vendor-published implementation guarantee.
| Tool | Best launch signal | Setup burden | Commercial model | Main limitation |
|---|---|---|---|---|
| PostHog | Acquisition through product behavior | Moderate; define and instrument product events | Hosted or self-hosted options; review usage and plan terms | More surface area than a basic site counter |
| Google Analytics 4 | Website acquisition and event activity | Moderate to high for a cross-site/app funnel | Standard product and separate Analytics 360 offering | App activation analysis takes deliberate configuration |
| Plausible Analytics | Website traffic and selected conversion goals | Low to moderate for focused site measurement | Subscription plans | Not a full in-product behavior workspace |
| Fathom Analytics | Website-focused launch reporting | Low to moderate; more for custom or cross-product needs | Subscription plans | Less suited to deep activation and retention questions |
| Mixpanel | Product funnels and retention | Moderate to high; event plan and instrumentation matter | Plan-based options | Requires an owner and consistent product events |
| Amplitude | Product behavior and return use | Moderate to high; plan events and identities | Plan-based offerings | Can exceed a small team’s needs and capacity |
How to choose for your launch
Start with the decision, then pick the measurement layer
Write down the decision you want the data to change. “Did launch day work?” is too vague to select software. A more useful set of questions might be: which channel brought qualified visitors, what share created an account, and what share completed one product-specific first-value action? Choose the smallest tool that can answer the questions you will review. If you have not yet agreed what first value means, settle that definition before comparing dashboard features.
- Choose Plausible or Fathom if you mainly need a clear view of website traffic and a few explicit conversion events.
- Choose GA4 if website acquisition reporting is central and the team can own its event configuration.
- Choose PostHog, Mixpanel, or Amplitude if the important evidence begins after signup and you will instrument product behavior.
That is a workflow distinction, not a performance ranking. Do not infer that a product-analytics tool will improve conversion by itself. It provides a way to examine behavior; product changes, traffic quality, and the offer determine what happens next.
Keep the first scorecard small
For an illustrative early-stage launch scorecard, track one acquisition measure, one signup measure, and one activation measure. For example: visits from a named launch source, completed account creations, and completion of a product action that represents first value. The example is a starting policy, not a universal benchmark. Add retention only when the time window and expected usage pattern make it interpretable. Avoid combining unrelated events into a single “engagement” number; it hides which step needs attention.
Before launch, run a short verification checklist:
- Event meaning: Write down what triggers each event and what does not.
- Source attribution: Use consistent campaign labels so launch traffic is distinguishable from direct or returning visits.
- Identity: Decide how anonymous visitors and signed-in users are represented, especially across the marketing site and app.
- Ownership: Name the person who checks instrumentation and reviews the scorecard.
- Terms and cost: Confirm current vendor pricing, limits, data handling, and any plan-specific conditions on the official pages before implementation.
One practical tie-breaker: if the team can only maintain one instrumented funnel, prioritize the journey nearest to customer value. A waitlist click may be useful for validating a message, while a completed core action is better evidence that the product itself is delivering. Keep both only if each informs a distinct decision.
Analytics explain what happened on your own product; they do not replace discovery among early adopters. SuperPublic supports indie product submissions, launch-page publishing, discovery, and founder-community participation. If you are preparing a launch, you can submit your product launch and use your chosen analytics setup to evaluate what happens after visitors arrive. Visit SuperPublic to explore its launch and discovery platform.
Authored with NotFair SEO